* master => main

Signed-off-by: Joe Elliott <number101010@gmail.com>

* master => main

Signed-off-by: Joe Elliott <number101010@gmail.com>

* master => main

Signed-off-by: Joe Elliott <number101010@gmail.com>
Docker-compose
So you found your way to the docker-compose examples? This is a great place to get started with Tempo, learn some basic configuration and learn about various trace discovery flows.
If you are interested in more complex configuration we would recommend the tanka/jsonnet examples.
Build Images (Optional)
This step is not necessary, but it can be nice for local testing. Rebuilding these images will cause docker-compose to use whatever local code you have in the examples.
Run the following from the project root folder to build tempo:latest and tempo-query:latest images
that will be used in the test environment:
make docker-images
Grafana 7.4.x
All of the included examples are designed to work with Grafana 7.5.x and forward. If you are using Grafana 7.4.x or before then you need
to use tempo-query along with Tempo for querying. Please see the docker-compose.grafana7.4.yaml example and choose the
Tempo-Query datasource in explore.
Storage options
Tempo can be run with local storage, S3, Azure, or GCS backends. See below for examples of local and S3 (Minio) storage.
Local Storage
In this example all data is stored locally in the example-data/tempo folder.
- First start up the local stack.
docker-compose up -d
At this point, the following containers should be spun up -
$ docker-compose -f docker-compose.local.yaml ps
                  Name                                 Command               State                         Ports
--------------------------------------------------------------------------------------------------------------------------------------
docker-compose_grafana_1                    /run.sh                          Up      0.0.0.0:3000->3000/tcp
docker-compose_prometheus_1                 /bin/prometheus --config.f ...   Up      0.0.0.0:9090->9090/tcp
docker-compose_synthetic-load-generator_1   ./start.sh                       Up
docker-compose_tempo-query_1                /go/bin/query-linux --grpc ...   Up      0.0.0.0:16686->16686/tcp
docker-compose_tempo_1                      /tempo -storage.trace.back ...   Up      0.0.0.0:32772->14268/tcp, 0.0.0.0:32773->3100/tcp
- If you're interested you can see the wal/blocks as they are being created.
ls ./example-data/tempo
- The synthetic-load-generator is now printing out trace ids it's flushing into Tempo. To view its logs use -
docker-compose logs -f synthetic-load-generator
.
.
synthetic-load-generator_1  | 20/10/24 08:27:09 INFO ScheduledTraceGenerator: Emitted traceId 57aedb829f352625 for service frontend route /product
synthetic-load-generator_1  | 20/10/24 08:27:09 INFO ScheduledTraceGenerator: Emitted traceId 25fa96b9da24b23f for service frontend route /cart
synthetic-load-generator_1  | 20/10/24 08:27:09 INFO ScheduledTraceGenerator: Emitted traceId 15b3ad814b77b779 for service frontend route /shipping
synthetic-load-generator_1  | 20/10/24 08:27:09 INFO ScheduledTraceGenerator: Emitted traceId 3803db7d7d848a1a for service frontend route /checkout
.
Logs are in the form
Emitted traceId <traceid> for service frontend route /cart
Copy one of these trace ids.
-
Navigate to Grafana and paste the trace id to request it from Tempo. Also notice that you can query Tempo metrics from the Prometheus data source setup in Grafana.
-
To stop the setup use -
docker-compose down -v
S3
In this example tempo is configured to write data to S3 via MinIO which presents an S3 compatible API.
- First start up the s3 stack.
docker-compose -f docker-compose.s3.minio.yaml up -d
At this point, the following containers should be spun up -
$ docker-compose ps
                  Name                                 Command               State                        Ports
-------------------------------------------------------------------------------------------------------------------------------------
docker-compose_grafana_1                    /run.sh                          Up      0.0.0.0:3000->3000/tcp
docker-compose_minio_1                      sh -euc mkdir -p /data/tem ...   Up      0.0.0.0:9000->9000/tcp
docker-compose_prometheus_1                 /bin/prometheus --config.f ...   Up      0.0.0.0:9090->9090/tcp
docker-compose_synthetic-load-generator_1   ./start.sh                       Up
docker-compose_tempo-query_1                /go/bin/query-linux --grpc ...   Up      0.0.0.0:16686->16686/tcp
docker-compose_tempo_1                      /tempo -config.file=/etc/t ...   Up      0.0.0.0:32770->14268/tcp, 0.0.0.0:3100->3100/tcp
-
If you're interested you can see the wal/blocks as they are being created. Navigate to minio at http://localhost:9000 and use the username/password of
tempo/supersecret. -
The synthetic-load-generator is now printing out trace ids it's flushing into Tempo. To view its logs use -
docker-compose logs -f synthetic-load-generator
.
.
synthetic-load-generator_1  | 20/10/24 08:26:55 INFO ScheduledTraceGenerator: Emitted traceId 48367daf25266daa for service frontend route /currency
synthetic-load-generator_1  | 20/10/24 08:26:55 INFO ScheduledTraceGenerator: Emitted traceId 10e50d2aca58d5e7 for service frontend route /cart
synthetic-load-generator_1  | 20/10/24 08:26:55 INFO ScheduledTraceGenerator: Emitted traceId 51a4ac1638ee4c63 for service frontend route /shipping
synthetic-load-generator_1  | 20/10/24 08:26:55 INFO ScheduledTraceGenerator: Emitted traceId 1219370c6a796a6d for service frontend route /product
.
Logs are in the form
Emitted traceId <traceid> for service frontend route /cart
Copy one of these trace ids.
-
Navigate to Grafana and paste the trace id to request it from Tempo. Also notice that you can query Tempo metrics from the Prometheus data source setup in Grafana.
-
To stop the setup use -
docker-compose -f docker-compose.s3.minio.yaml down -v
Azure
In this example tempo is configured to write data to Azure via Azurite which presents an Azure compatible API.
- First start up the azure stack.
docker-compose -f docker-compose.azure.azurite.yaml up -d
At this point, the following containers should be spun up -
$ docker-compose -f docker-compose.azure.azurite.yaml ps
                  Name                                 Command               State                         Ports
--------------------------------------------------------------------------------------------------------------------------------------
docker-compose_azure-cli_1                  az storage container creat ...   Exit 0
docker-compose_azurite_1                    docker-entrypoint.sh azuri ...   Up       0.0.0.0:10000->10000/tcp, 10001/tcp
docker-compose_grafana_1                    /run.sh                          Up       0.0.0.0:3000->3000/tcp
docker-compose_prometheus_1                 /bin/prometheus --config.f ...   Up       0.0.0.0:9090->9090/tcp
docker-compose_synthetic-load-generator_1   ./start.sh                       Up
docker-compose_tempo-query_1                /go/bin/query-linux --grpc ...   Up       0.0.0.0:16686->16686/tcp
docker-compose_tempo_1                      /tempo -config.file=/etc/t ...   Up       0.0.0.0:32768->14268/tcp, 0.0.0.0:3100->3100/tcp
-
If you're interested you can see the wal/blocks as they are being created. Check Azure Storage Explorer and Azurite docs.
-
The synthetic-load-generator is now printing out trace ids it's flushing into Tempo. To view its logs use -
docker-compose logs -f synthetic-load-generator
.
.
synthetic-load-generator_1  | 20/10/24 08:26:55 INFO ScheduledTraceGenerator: Emitted traceId 48367daf25266daa for service frontend route /currency
synthetic-load-generator_1  | 20/10/24 08:26:55 INFO ScheduledTraceGenerator: Emitted traceId 10e50d2aca58d5e7 for service frontend route /cart
synthetic-load-generator_1  | 20/10/24 08:26:55 INFO ScheduledTraceGenerator: Emitted traceId 51a4ac1638ee4c63 for service frontend route /shipping
synthetic-load-generator_1  | 20/10/24 08:26:55 INFO ScheduledTraceGenerator: Emitted traceId 1219370c6a796a6d for service frontend route /product
.
Logs are in the form
Emitted traceId <traceid> for service frontend route /cart
Copy one of these trace ids.
-
Navigate to Grafana and paste the trace id to request it from Tempo. Also notice that you can query Tempo metrics from the Prometheus data source setup in Grafana.
-
To stop the setup use -
docker-compose -f docker-compose.azure.azurite.yaml down -v
Loki Derived Fields
This example presents a complete setup using Loki to process all container logs, and linking between the extracted traceIDs and tempo.
- First we have to install the Loki docker driver. This allows applications in our docker-compose to ship their logs to Loki.
docker plugin install grafana/loki-docker-driver:latest --alias loki --grant-all-permissions
- Next start up the Loki stack.
docker-compose -f docker-compose.loki.yaml up -d
At this point, the following containers should be spun up -
$ docker-compose -f docker-compose.loki.yaml ps
            Name                          Command               State            Ports
------------------------------------------------------------------------------------------------
docker-compose_grafana_1       /run.sh                          Up      0.0.0.0:3000->3000/tcp
docker-compose_loki_1          /usr/bin/loki -config.file ...   Up      0.0.0.0:3100->3100/tcp
docker-compose_prometheus_1    /bin/prometheus --config.f ...   Up      0.0.0.0:9090->9090/tcp
docker-compose_tempo-query_1   /go/bin/query-linux --grpc ...   Up      0.0.0.0:16686->16686/tcp
docker-compose_tempo_1         /tempo -storage.trace.back ...   Up      0.0.0.0:32774->14268/tcp
- Navigate to Grafana and query Loki a few times to generate some traces (this setup does not use the synthetic load generator and all traces are generated from Loki). Something like the below works, but feel free to explore other options!
{container_name="dockercompose_loki_1"}
Note: When running docker-compose on a MacBook, the
container_namewould bedocker-compose_loki_1.
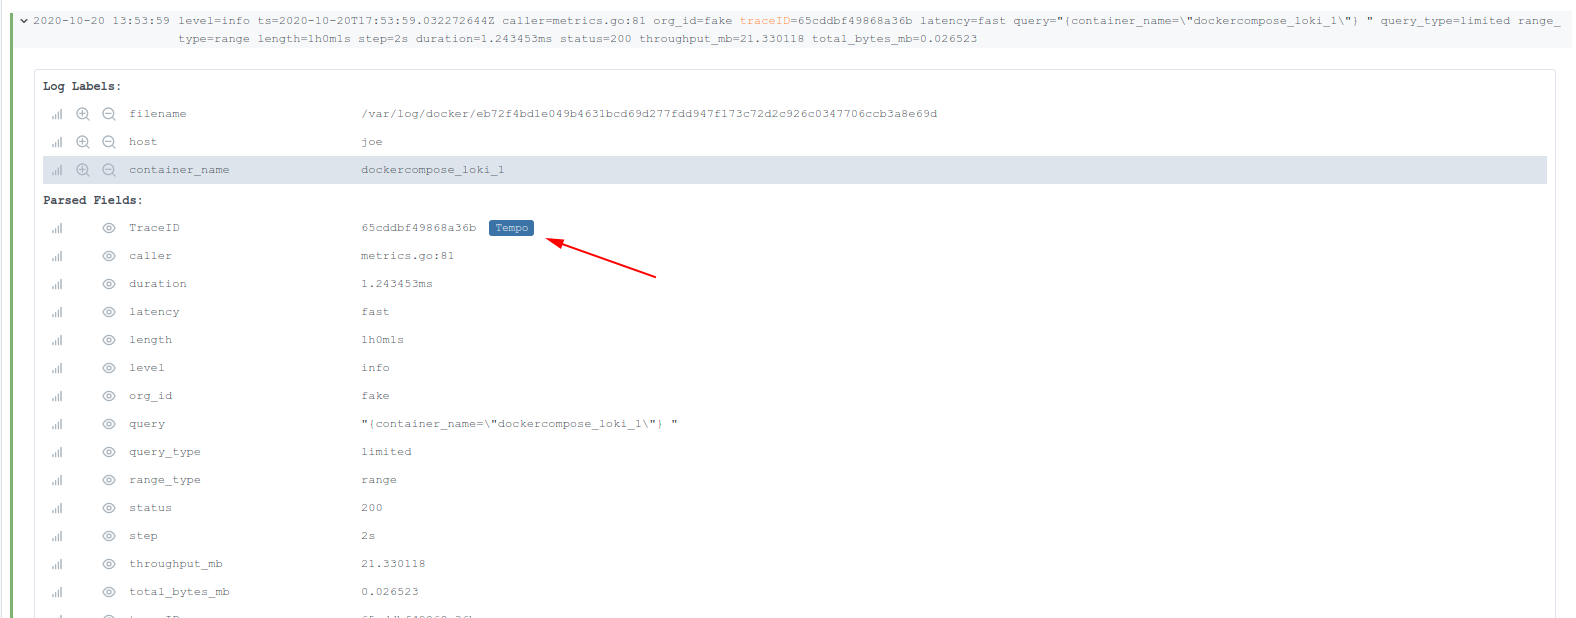
- Now let's execute a query specifically looking for some trace ids. In an operational scenario you would normally be using Loki to search for things like query path, or status code, but we're just going to do this for the example:
{container_name="dockercompose_loki_1"} |= "traceID"
Note: When running docker-compose on a MacBook, the
container_namewould bedocker-compose_loki_1.
- Drop down the log line and click the Tempo link to jump directly from logs to traces!
- To stop the setup use -
docker-compose -f docker-compose.loki.yaml down -v